Nov
Electricity Regional Price Variations
Posted by
 It would be a fair assumption that the majority of commercial end users of electricity think that the cost of electricity to be pretty much the same throughout the UK, whether they are based in Aberdeen, Kings Lynn or Weston Super-Mare. The reality is somewhat different with variation around the country based on a number of factors. Thus many clients express some consternation about similar consuming sites within a group having, sometimes very different pricing. Electricity prices can differ around the nation and can vary significantly from region to region. To name a few these factors contributing to this:
- Differing tariffs across different electricity suppliers. All energy suppliers have differing products that they sell to the consumer and it is never as simple as just one price for the supply of electricity. Some of this is historic with the former ‘Electricity Boards’ creating a wealth of specialist tariffs to suit a variety of requirements. Whilst de-regulation has brought much more conformity there are still unusual tariffs still to be found. These can include, differing charges for a standing or fixed charge either per day, month or quarter. Then the main unit rate can either be single, two rate, three rate anywhere up to six rates for the same supply of electricity and this is before we delve into the world of half hourly metered electricity.
- Whilst also there are the additional taxes, levies and fees that can be applied, in practice these are generally applied [not always!] in a set way across all tariffs based on consumption. There continues to be some confusion with exemptions linked to industry type, size and even an inability on the part of suppliers’ systems to bill effectively.
- The main cost variance geographically is down to distribution costs.
Numerous parties are involved, for generation, supply, distribution and metering. To get electricity to a plug socket, there are the practical logistics of ‘shipping’ it to you. These costs are the responsibility of the National Grid Company and apply equally whichever Supplier you choose. [Whether they add a margin to these costs is another matter.]
Distribution Network Operators
 Electricity distribution networks carry electricity from the transmission systems and some generators that are connected to the distribution networks to commercial users.
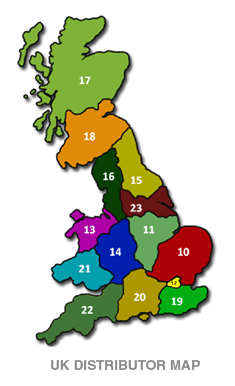
As can be seen from the UK electricity distributor map on the right, there are 14 licensed distribution network operators (DNOs) each responsible for a distribution services area. The 14 DNOs are owned by six different groups. There are also four independent network operators who own and run smaller networks embedded within the DNO networks.
Most commercial consumers buy their electricity from suppliers who pay the DNOs for transporting their customers’ electricity along their networks. Suppliers pass on these costs to consumers and distribution costs account for about 20 per cent of electricity bills.
Electricity distribution networks are effectively regional monopolies because there is only one owner/operator for each area and whilst Ofgem administers a price control regime that ensures the limiting of amounts that customers can be charged, one of the key challenges facing the electricity distribution industry is the connection of renewable and other generation plants to networks which have traditionally carried electricity from large power stations in one direction only.
Price Differences
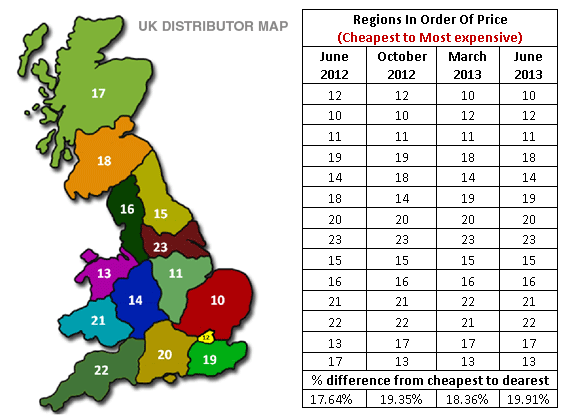
As shown in the table below, different regions are cheaper and more expensive at different times of the year, although there is some consistency as the differing regions never move more than two places up or down. To summarise:
- Regions 10 (East Anglia) and 12 (London) are continuously among the cheapest areas for electricity supply.
- Regions 17 (Northern Scotland) and 13 (North West Wales) are continuously among the most expensive areas for electricity supply.
- The average % difference between the cheapest region and dearest region is a whopping 18.43%.
- Over the course of the 12 month period region 21 (South West Wales) saw the largest price increase, at 14.06%.
- Over the course of the 12 month period region 20 (Southern) saw the smallest price increase, at 9.76%.

Torse Summary
To summarise the continued rise in electricity prices over the past few years is often cited as being due to ‘large oligopolistic organisations’ making handsome profits to the detriment of Joe Public. Whilst this is true in many circumstances; it is clear to see that there are other factors involved in the geographical cost of electricity prices which has been highlighted by the variation in distribution costs around the UK. As not only are the variations different but can range up to nearly a maximum difference of 20%. Considering that this makes up for nearly 20% of the consumer electricity bill it is not difficult to see how there can be a large difference between what one business can be charged for electricity as opposed to another.
In an ideal world these distribution charges would at least be negotiable and competitive across the market. However as there is no choice; as your distributor for your region is set, there is literally nothing that Torse or anyone can do about these charges. Meaning that these charges must be regulated by Ofgem, although given that there is choice for your electricity supplier and colossal mess that has ensued, with that part of the electricity market, perhaps it is better this way, if not entirely fair?
- Bookmark :
- Digg
- del.icio.us
- Stumbleupon
- Redit it
Sorry, the comment form is closed at this time.


